Showing posts with label cloud. Show all posts

June 14, 2023

Changing the focus of this blog: now... Observability

My previous post about Infrastructure as Code concludes the exploration of Data Center and Cloud solutions and the methodologies that are related to automation and optimization of IT processes.

I've been working in this area for 15 years, after spending the previous 15 in software development. 
It's been an amazing adventure and I really enjoied learning new things, exploring and challenging some limits - and sharing the experience with you.

Now I start focusing on a new adventure... possibly for the next 15 years 😜

I assumed a new professional role, that is the technical lead for Full Stack Observability, EMEA sales, at Cisco Appdynamics. From now on, I will tell you stories about my experience with the ultimate evolution of monitoring: it's all about collecting telemetry from every single component of your business architecture, including digital services (= distributed software applications), computing infrastructure, network, cloud resources, IoT, etc.

It's not just putting all those data together, but correlating them to create an insight. Transforming raw data into information about the health state of your processes, matching business KPI with the state of the infrastructure that supports the services.

To visualize that information and to navigate it, you can subscribe to (or create your own) different domain models, that are views of the world built specifically for each stakeholder: from lines of business to applications managers, from SRE to network operations and security teams...

A domain model is made of entities and their relationships, where entities represent what is relevant in your (business or technical) domain. They might be the usual entities in a APM domain (applications, services, business transactions...) or infrastructure entities (servers, VM, clusters, K8s nodes, etc.). 
You can also model entities in a business domain (e.g. trains, stations, passengers, tickets, etc.).


Unlike Application Performance Monitoring (APM), where solutions like Appdynamics and its competitors excel in drilling down in the application architecture and its topology, with Full Stack Observability you really have full control end-to-end and have a context shared among all the teams that collaborate at building, running and operating the business ecosystem.

New standards like OpenTelemetry make it easy to convey Metrics, Events, Logs and Traces (MELT) to a unique platform from every single part of the system, including eventually robots in manufacturing, GPS tracing from your supply chain, etc.

All these data will be filtered according to the domain model and those that are relevant will feed the databases containing information about the domain entities and their relationships, that are used to populate the dashboard.


Those data will be matched with any other source of information that is relevant in your business domain (CRM, sales, weather forecast, logistics...) so that you can analyse and forecast the health of the business and relate it to the technologies and the processes behind. You can immediately remediate any problem because you detect the root cause easily, and even be proactive in preventing problems before they occur (or before they are perceived by end users). At the same time, you are able to spot opportunities for optimising the preformances and the cost efficiency of the system.

To see what is the official messaging from Cisco about the Full Stack Observability, check this page describing the FSO Platform

Stay tuned, interesting news are coming...


June 9, 2023

Infrastructure as Code: making it easy with Nexus as Code

In previous posts I've described the advantage provided by managing the infrastructure the same way developers manage the application code.

Infrastructure as Code means using the same toolset (version control systems, pipeline orchestrators, automated provisioning) and same processes for building, integrating, testing and releasing the system that are used in the release cycle of a software application. This approach has a positive impact on speed, reliability and security end to end.


Together with Ansible, Terraform is one of the most used tools in the automated provisioning space, and many organizations use it when they adopt Infrastructure as Code. The availability of plugins (Terraform Providers) for almost every possible target (physical and virtual servers, network and storage, cloud services, etc.) makes it a common platform for automation: a "de facto" standard.

As many other technology vendors, Cisco offers Terraform Providers wrapping the API of their products, especially for Data Center and Cloud technologies. The Nexus family of switches, that includes the ACI fabric architecture, makes no exception. You can provision and manage the ACI fabric easily with Terraform (as well as with Ansible), and many examples and reusable assets are available at DevNet.

Generally, Terraform Providers surface the object model of the target system so that resources and the their relationships can be managed easily in a configuration plan, representing the desired state of the system. You need to understand how that particular system works and, in some cases, to manage the relationships among managed objects identifiers explicitly.

This is an example of creating a tenant in ACI, and a VRF contained in it:


Some engineers find this object model, and the use of the HCL (Hashicorp Configuration Language), easy and comfortable. Others, maybe due to a limited experience, would prefer an easier syntax and simpler object model.

For this reason Cisco has created a module called Nexus as Code, that sits on top of the standard ACI provider for Terraform, hiding the perceived complexity and offering a simplified object model. The objects that are contained in each other are simply nested and represented in a way that's very close to the conceptual representation of the logical architecture (represented by the following picture)


Nexus as Code can be seen as a (optional) component in the Terraform solution to automate ACI and other network controllers from Cisco.


Using a configuration language as simple as YAML, nesting is represented with indentation in Nexus as Code. This example corresponds to the HCL snippet above:


This format is particularly suitable for copy/paste operations, that make it easy to clone and modify a template so it is ready for a new project.

If you start from the example above, simply copying one line you can have one more VRF created and contained in the same tenant. Definitely simpler that doing the same in a HCL file, and encouraging for a network engineer the first time he/she uses Terraform. 

Everything you need is a folder to store one or more YAML file defining the desired state of the ACI fabric, and the installation of the Terraform binary file (free download from here). After that, you will just use the following two commands:

terraform init (that makes sure that the needed providers are installed, and eventually downloads them automatically)


terraform apply (that reads the input, evaluates changes required to align the state of the target fabric to the desired state, then call the API of the ACI controller)


when you confirm the apply, you will see the log of the execution and finally the message will tell that the job is done.


I believe that Nexus as Code is a powerful tool that may help engineers to approach the IaC (Infrastructure as Code) methodology easier, with no stress due to learning new complex technologies and tools.

Being based on standard, open-source tools, it does not introduce any lock in with Cisco technologies. 
It simply translates easy-to-manipulate YAML files, that describe your desired state, into plain Terraform plans that are executed automatically.

So you can start adopting the same tools and same processes that developers use in building, integrating, testing and releasing the system, obtaining the same benefit in terms of speed, consistency, security and self-documentation.

Don't be shy, start today to experiment and see how easy it is 😜


April 28, 2022

Infrastructure as Code: what's the advantage

This post describes the value provided by managing the infrastructure the same way you manage the source code of software applications, applying standard tools and best practices to the automation. The reference to infrastructure, of course, includes all cloud services incorporated in your architecture.

The following topics areI explore in this post. More posts will follow with a deeper investigation, and to show what is the link between Infrastructure as Code (IaC) and DevOps.

  • What does Infrastructure as Code mean?
  • Is IaC a product I can buy?
  • Most common use cases.
  • From where do I start?
  • Resources to practice with Infrastructure as Code.


What does Infrastructure as Code mean

Infrastructure as code (IaC) is the process of managing and provisioning data center environments through machine-readable definition files, rather than physical hardware configuration or interactive configuration tools. 

The IT infrastructure managed by this process includes both physical equipment, such as bare-metal servers, storage and network, as well as virtual machines, and associated configuration resources. The same concept applies to public cloud resources, i.e. IaaS and PaaS services.

The definition files for Infrastructure as Code are maintained in a version control system, similarly to what we do with source code of software applications. Generally, in these files you describe the desired state of the system, rather than a sequence of commands that must be executed. This implies that you trust a component in the infrastructure, called a controller, delegating all the logic and the exception handling to it (or to more than one).


Descriptive model, not commands.

You don't configure the individual components of the system (e.g. 20 switches, or 5 servers or 15 virtual machines and their virtual network) one by one, in the right order, managing eventual error conditions and verifying manually that everything work as expected.

You simply describe what you expect the system to look like to a software controller, that owns the configuration of all the individual components. The controller knows how to contact, provision and configure the elements and to make sure your intent is realised. If any command fails, everything is rolled back to ensure a clean state. The APIC controller in the Cisco ACI architecture has this role, but many examples can be found among Cisco products and other vendors', and open-source solutions.

It is like ordering a slice of cake 


  versus preparing the cake yourself following the recipe from your grandma:

In other architectures you don't have a centralised controller, but the programmability of the individual targets and the API that they expose allow for a remote, automated management that is still much better than using the command line interface or any GUI offered by the device. One script could update the configuration of dozens of devices at the same time, e.g. adding a VLAN to all the switches in the network. 


Treat infrastructure like software (source control, single source of truth).

The input files for this process are text files, using different formats based on the tool you use. They might contain variables, whose values are defined externally to make the template reusable (e.g. via environment variables, databases, or systems designed to keep secrets like Vault). I use the word template for Ansible playbooks, Terraform plans, etc.

In any case these are text files, like the files that contain the source code of a software application. And they can be treated the same way: stored in a versioning system, edited collaboratively, subject to role-based access control, retrieved and built automatically by a pipeline orchestrator. 

When you adopt this approach, the latest validated version of the system configuration is stored in the versioning system. You can consider that one the single source of truth, rather than the current configuration of the system (that might be corrupted by uncontrolled manual changes, either made intentionally or by mistake, or consciously applied long time ago for a reason that nobody remembers today). Instead, the last committed version in the repository is documented (including the tests that it passed) and ready to be applied again to reset the system, in case you need to solve a configuration drift, or to clone the environment, or for other use cases that require consistency.


Provision and configure entire environments

One example is creating clones of a complete environment, including computing, network and storage resources, to deploy an application in the different phases of the release process. Even with different sizing, being generated by a single template (or blueprint) makes sure they are identical in the configuration that influences the behaviour of the applications deployed.
There will be no surprise due to a missing configuration of a firewall port, of a datastore or a vlan trunk: consistency is granted, troubleshooting is limited.


Ensure idempotence

Idempotence is the property of certain operations in mathematics and computer science whereby they can be applied multiple times without changing the result beyond the initial application (you can find the complete definition here). Well designed API ensure that repeated calls with the same input will not alter the state of the system, that is good because in case of retry you don't risk to create duplicated resources or other troubles.


Is Infrastructure as Code a product I can buy?

No: IaC is a methodology, not a product. It's a set of best practices that you can gradually adopt, and learn step by step. You can start with basic use cases, like creating a new tenant with a few associated resources, if that is a recurring activity and you want to make it faster and error-proof.

Then you will grow with more complex use cases, like creating an entire test environment on demand with all needed resources, including services from a cloud platform. The adoption of Infrastructure as Code is not a big bang, you don't need to build complete automation with no manual activity in one week. You can target quick wins, that validate the approach and generate momentum in the organization. The critical factor in the adoption is change management (i.e. the introduction of a new operational model and new ways of doing things), not the technology. 


Of course you need supporting tools: automation frameworks like Ansible and/or Terraform (eventually also scripting languages could do the job), versioning systems, collaboration systems. And your infrastructure needs to be programmable (public cloud is programmable by default), meaning that your servers, networks, storage should be managed via  software controllers or, at least, expose well-documented API.


Common use cases for Infrastructure as Code


Environments on demand

IT admins and the Operations teams receive a lot of requests from the applications teams: they need a configuration change to fix a problem or to deploy a new service, they need a new test environment, they need a clone for a new tenant, etc. Most of these requests cannot be satisfied immediately because of higher priorities, or because they require the collaboration of different teams that needs planning.

If the provisioning of the system - and some "day 2 operations" - was automated, with controlled execution of validated templates, both parties (Dev and Ops) would save time and be more satisfied... and efficient, for the benefit of the entire company.  


Shared resource pool to increase efficiency

Some companies keep separate environments for each stage of a project: integration test, performance test, quality assurance, production, etc. Resources are always allocated, regardless they are only used - let's say - a week every three months (the interval may vary between one day and one year): only when they release a new version of the project, or have a maintenance windows for deploying bug fixes.

Keeping resources allocated when they are not in use is a waste of capacity, hence a waste of money. Imagine if you multiply the waste by the number of projects. But they cannot do it differently because of the complexity and the time required to build the different environments.

If they could - and with automation they can - recreate an identical environment, end to end, whenever required, they could dispose each environment as soon as it's no longer in use. Knowing that they can recreate it in minutes, they would reuse the returned resources for another stage or another project.
Using a shared resource pool (computing, networking and storage) for many project would be more efficient from a cost perspective. It applies to fixed capacity (less capex: you need to buy less hardware to satisfy all the requests) but also to pay per use scenarios (less opex: you dismiss resources when not needed).


Disaster Recovery

In case you need to repurpose existing or new resources to recover from a disaster, recreating a clone of the system from a single source of truth is much faster and safer. Generating the new infrastructure from the same blueprint that had created the old one, makes sure they are identical.


Blueprints and Compliance

Subject matter experts from every technology domain that collaborate to provision and maintain a system, instead of being engaged every time, could design and release Infrastructure as Code models once. Users (i.e. applications teams or other operations teams) could then use the blueprints for a self-service provisioning, without depending on the availability of the SME. The SME would save their time, feeling safe because the blueprints respect all the defined constraints and comply with the policies (no provisioning anarchy is allowed). 


Auditing

Running automation scripts with standardised logging, or better using a pipeline orchestrator for provisioning and configuring systems, would trace what operations have been done, by whom, the input and the outcome. Very useful audit information, with no effort. 


From where do I start?


Tools: Ansible and Terraform

Those are the most widely used tools for automation (with or without an Infrastructure as Code approach). They are open-source and free, easy to use. An enterprise version also exist, and in some cases you will find it very useful. But you can start practicing with the free tool and use it for years, with great advantage, if you are the only responsible for the infrastructure. In case of teamwork, you can still use the free version and dedicate some time to build your own operational model and additional tools, or you can switch to the enterprise version that makes it easy to scale at the enterprise level.

You can download the software from the Ansible and Terraform websites, along with good documentation and reusable examples (see below). Good tutorials are also available.


Single operating tool: Cisco Intersight 

Cisco Intersight™ is a Software-as-a-Service (SaaS) hybrid cloud operations platform which delivers intelligent automation, observability, and optimization to customers for traditional and cloud-native applications and infrastructure. It supports Cisco Unified Computing System™ (Cisco UCS®) and Cisco HyperFlex™ hyperconverged infrastructure, other Intersight-connected devices, third-party Intersight-connected devices, cloud platforms and services, and other integration endpoints. Because it’s a SaaS-delivered platform, Intersight functionality increases and expands with weekly releases.

With Intersight, you get all of the benefits of SaaS delivery and full lifecycle management of distributed infrastructure and workloads across data centers, remote sites, branch offices, and edge environments. This empowers you to analyze, update, fix, and automate your environment in ways that were not previously possible. As a result, your organization can achieve significant TCO savings and deliver applications faster in support of new business initiatives.

See also Diving Deeper into Hybrid Cloud Operations with Intersight 


Resources to practice Infrastructure as Code

DevNet - Cisco's developers community, that offers tutorials, sandboxes, labs and reusable assets. This is the Infrastructure as Code page at DevNet: https://developer.cisco.com/iac/

Terraform - documentation, download and tutorials at https://www.terraform.io/. The integration with Cisco Intersight is explained at https://www.hashicorp.com/resources/standardizing-hybrid-cloud-environments-with-hashicorpterraform-and-cisco-intersi  

Ansible - documentation, download and tutorials can be found  at https://docs.ansible.com/ansible/latest/installation_guide/intro_installation.html 

Cisco workshops on Infrastructure as Code - feel free to contact me if you're interested in participating in our free, 3 x half days hands-on workshop.


January 22, 2020

Teaching Alexa to deploy applications in any cloud

Alexa, deploy a webserver in AWS and a database in Azure!


Recently I presented a session at Codemotion Milan, with my colleague Stefano Gioia.
We demonstrated how the API exposed by the Cisco CloudCenter Suite can be easily integrated from within an Alexa skill.


Of course, this is not something you would do in the real life in a production environment 🙂
But it’s an easy and funny way to show how easy the integration is, and we found it attractive for our customers and partners.
Instead of Alexa you could use any client, like a custom script from the command line, a workflow engine, a web portal or a ITSM system like ServiceNow to achieve the same result.
Any program that can do a REST call can drive CCS (CloudCenter Suite) externally to orchestrate the lifecycle of a software deployment.
In case you use Alexa, you will code the REST client logic in the serverless implementation of the “skill” that is executed as a Lambda function. You can use different languages to create the skills: we chose node.js for the demo.

We decided to show some basic CCS features like deploying any kind of software in any cloud, or measuring the cost of all the services we are consuming in all our clouds (for running VM and containers, for consuming cloud services like load balancers or network bandwidth, for running serverless functions. etc.). Of course there is much more in the product, but we wanted to keep the demo light and funny.


The 3 modules of the Cisco CloudCenter Suite


Everything you can do in the CloudCenter web portal can also be done through its REST API, and the CCS documentation shows examples you can easily reuse and adapt.

These are the API targets, for the different modules, that we used in the implementation of the skill:

Suite Admin API
/suite-idm/
E.g.: https://na.cloudcenter.cisco.com/suite-idm/api/v1/tenants

Workload Manager API
/cloudcenter-ccm-backend/api/v2/apps
E.g.: https://na.cloudcenter.cisco.com/cloudcenter-ccm-backend/api/v2/apps

Action Orchestrator API
/be-console/
E.g.: https://na.cloudcenter.cisco.com/be-console/api/v1/workflow

Cost Optimizer API
cloudcenter-shared-api
E.g.: https://na.cloudcenter.cisco.com/cloudcenter-shared-api/api/v1/costByProvider?cloudGroupId’


Next picture shows the high level process that allows a user to get something done by Alexa, just by speaking to a Echo device or to the Alexa mobile application.
The speech recognition system translates the user’s voice to text, then the “intent” of the user is matched to one of the functions available in the skill. Skills and their intent are executed based on patterns and keywords that the system is able to recognize in the natural language, thanks to machine learning algorithms.


Recognizing an intent triggers your custom code, that is generally a Lambda function (the Amazon developer console makes it easy to write the code and to host it in the Lambda service, providing also reusable examples). The outcome is rendered as audio or, depending on the device, also as a video.
In our specific demo, we put the client code for the Cisco CloudCenter API in the serverless implementation of the intent.
These are the commands that we can give Alexa:

  • give me the list of existing tenants
  • list all configured target clouds
  • deploy a database or a web server in a cloud
  • show current cost of all cloud services

Here you can see a sample of the capabilities of Alexa when it calls the Cisco CCS API:


Building a new Alexa custom Skill: as the skill developer, you have to:

  1. Define the requests the skill can handle
  2. Define the name Alexa uses to identify your skill, called the invocation name
  3. Define the utterances and input variables, called slots
  4. Write the code to fulfill the request
  5. Test it from the developer console or from your Alexa device


The documentation at the Amazon Developer console contains excellent tutorials to build Alexa skills.
You can learn easily to create a Hello World skill, then you are ready to incorporate the client code to call the CloudCenter Suite API.
Stefano has published his examples in github here, feel free to test it yourself.

This demo demonstrates that it's easy to build a client to drive the API exposed by CCS.
And it helps positioning the CloudCenter Suite as a mediation layer in your architecture, to orchestrate the lifecycle management and to define a governance model including cloud cost control.


June 20, 2019

A new community for Cisco Multicloud software users

Today we are launching a new project, that is a local community of people interested in the Cisco software solution for multicloud.

Before you go on reading, this is our next meeting:
Rome and Vimercate, October 23, 2019 - Cisco offices (details below)

Like many open source communities (e.g. meetups on various technologies) our goal is to spread information, share experience and offer access to experts to discuss your own use cases. In our opinion, this could be beneficial for customers, partners and people that are just curious about multicloud and the open source technologies. Of course, the expected result is also to facilitate sales of Cisco technology, products and projects.


That is the value for Cisco, but what's in it for you? 

We think that joining this community (meetings will be in Italian) you could learn the solutions offered by Cisco for multicloud in an informal context (and for free), understand what use cases you can implement and how, how Cisco technologies integrates with the open source technologies like Kubernetes, Docker and others, how to adopt DevOps and, why not, learn the open source stuff regardless the integration with Cisco products. We will also offer hands on labs and activities that matches learning and fun (e.g. teaching Alexa to deploy a database, or create a Kubernetes cluster).
In addition, you get some pizza and beer for free :-)
At the end of the day, it's an easy learning opportunity, a (bidirectional) share of experience, a stage where you can show - if you like - your knowledge and share the experience you've done in your project. Offering help to others or receiving support from peers and from the Cisco experts.


We are starting an experiment

We are starting with a few meetings planned, see the agenda below.
We thought that scheduling outside the office hours will make it easier for you to join, avoiding conflicts and positioning this community as a place where you go for fun. Or, at least, with no relation with your role in your company. As an individual you learn subjects that make your work easier and your resume more interesting, so maybe this is worth dedicating 2-3 hours in your spare time (e.g. every second Thursday of each month, from 5 to 8 pm, pizza included).
We will ask your feedback about the schedule, so that we move to a different time of the day or cadence according to your preference.
And, of course, about the subjects we're going to address in next meetings so that we stay relevant for you.
An additional value is introducing you with the official Cisco DevNet community, that is our developers community.
We are going to leverage a lot of amazing material from DevNet, including documentation, tutorials and sandboxes where you can experiment with no need to install the products and no fear of destroying the environment: it's there for your enjoyment and will be reset after you use it.
Every event will be split in 2-3 sessions:
  • one based on presentation/demo of a Cisco product, 
  • one based on a subject from the open source world that is not necessarily related to Cisco. Sometimes the integration of open source and Cisco API will be demonstrated.

We will keep each session short and crispy and every event will have a hands-on activity to keep you awake.
When possible we'll add a lab activity that participants can do directly from their laptop.


Next topics

This is a temporary, draft list of the subjects we could offer in the first series of meetings: we can prioritize them based on internal feedback or through a survey with the attendees of first meetings (or sent remotely to the community).
  • Amazon Alexa integration
  • Devops - CI/CD with CloudCenter - (VM)
  • Devops - CI/CD with CloudCenter - (containers)
  • The ACI CNI (ltechnical intro)
  • The ACI CNI (use cases, operational model)
  • Multcloud cost control
  • Serverless lab
  • Devnet sandboxes
  • Devnet Express - programmability
  • Meet The Engineer or design clinic - bring your on use cases
  • ACI and Terraform
  • Managing k8s clusters in cloud and on prem
  • Automating the Software-Defined WAN

The next event we have planned is at the Cisco offices in Rome and Vimercate, on October 23, 2019.

Address: 

Time: 

  • from 5 pm to 8 pm (pizza and beer included)


This is the proposed
agenda (no technical requirements to attend):

- Why this meetup (10')
Container track: container 101 (theory, use cases, application architectures)
- Cost control with CloudCenter (30')
- Pizza & beer
- DevOps: Testing methodology (30')

Registration required


To register for the event, please click here.
See you soon!


References

Cisco DevNet - https://developer.cisco.com 


March 27, 2018

Why do you run slow, fragile and useless applications and are still happy?


If you are not interested in the detail, at least browse the post and watch the amazing video recordings embedded   :-)

We have already discussed the value of automation in the deployment of software applications.
It is also clear that collecting telemetry data from systems and applications into analytic platforms enhances visibility and control, with an important return on your business.

Cisco offers best of breed solutions for both automation and analytics, but the biggest value is in their  integration end to end. Your applications can be deployed with Cisco CloudCenter and completely controlled with AppDynamics and Tetration, with no manual intervention.

Why do you need that visibility?


Thanks to the information provided by AppDynamics, you have immediate visibility of the performances and the dependency map of your software applications. Tetration exposes its compliance and the performances from a system standpoint.
CloudCenter offers your users a self service catalog where applications can be selected for deployment in one of the clouds you have configured as a target: but the smartest feature is that every deployment can also install the sensors for AppDynamics and Tetration automatically in each node of the application topology, so that telemetry data start to be collected immediately.
why we need to collect information at runtime


With that, now you have no excuse to keep running applications that do not perform well enough, that expose vulnerabilities and that produce limited business return due to poor customer satisfaction or inefficiency. The same applies to non compliant applications that break your security rules or your architectural standards, that were deployed some years ago and now are untouchable due to complexity and lack of documentation.

With such an easy integration of telemetry and the insight that you can get immediately, it makes no sense keep those monsters running in your datacenter or in your cloud. You can evolve them and remove the bottlenecks and security risks once identified.


analytics tools add value to the application telemetry
Analytic tools add value to the application telemetry


We want to demonstrate how easy it is.

This post is a follow up to the demonstration of the integration of Cisco CloudCenter with Tetration: we extended the demo with the addition of AppDynamics, so that our applications are now completely under control when it comes to security, compliance, performances and business impact.

Architectural Overview


We used a well known application as an example: WordPress is an open source tool for website creation, written in php.  It uses a common LAMP stack: Apache + php + mySQL, running on Linux.
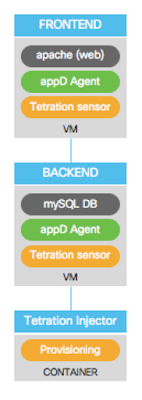
Wordpress is a two tier application, so you generally deploy two VM to run it: the front end is an Apache web server with the php application, the back end runs the database (mySQL).

We want that each tier is monitored, as a default, by both AppDynamics and Tetration. This must happen without introducing any complexity for the user that orders Wordpress from the self service catalog and must work in any target cloud. Based on the administrator preference, the user could even be unaware of the monitoring setup.


AppDynamics and Tetration integration with CloudCenter
Overview of the architecture


Next paragraphs describe the architecture of AppDynamics and of Tetration, so that you understand what integration we built to make CloudCenter inject telemetry sensors in each deployment. 
Then the process triggered when a user deploys Wordpress from the CloudCenter catalog is explained.
Detailed video recording of all the steps is also provided. 


AppDynamics: Architecture of the system


AppDynamics uses agents to collect information from the running servers and to send them to the controller. Agents are specific for the runtime of various programming languages, but there are also agents that interact only with the operating systems: you choose the type of agent that best fits each node. Also databases and their transactions can be monitored.
The Controller is where users go to view, understand, and analyze that data sent by agents.
Agents send data about usage metrics, code exceptions, error conditions and calls to backend systems to the Controller.

AppDynamics overview


CloudCenter: the Application Profile


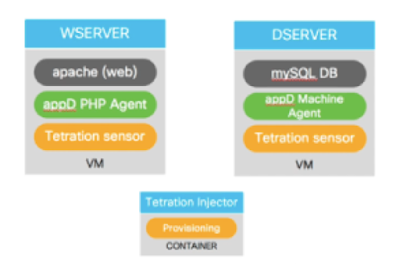
Next picture shows the Application Profile of the Wordpress service that we have created in CloudCenter. Each VM in the two tiers will contain the application and the required sensors for AppDynamics and Tetration. 

The Tetration injector component is an ephemeral Docker container that is used by CloudCenter just to invoke the API exposed by the Tetration cluster, so that the telemetry data are welcome when they arrive and associated to the scope of the Wordpress deployment. It disappears when the deployment is completed.

topology of the application deployment, showing the sensors applied
Topology of the application deployment, showing the sensors applied


As for any other application, the integration is implemented using custom scripts to deploy the agents for AppDynamics and Tetration
All application artifacts, scripts and services are stored in a Repository, and pulled by the CloudCenter agent running in each VM.
CloudCenter executes our scripts during different stages of the deployment, to add the AppDynamics Agent and the Tetration Sensor (using the same technique you could add any other agent that you use for backup, monitoring, etc.).
This is a video (2 min) showing how the Application Profile for Wordpress is built in CloudCenter:


CloudCenter integration with AppDynamics


The green boxes in next picture show the sequence of actions executed by the CloudCenter agent to deploy the AppDynamics php agent in the frontend VM: the same actions that the administrator would do manually.

installing and configuring AppDynamics agents
Installing and configuring AppDynamics agents


For your reference we used a shell script with placeholders, where configuration parameters are replaced by CloudCenter dynamically as listed below:

AGENT_LOCATION=“http://cc-repo.rmlab.local”
APPD_CONTROLLER="appd.rmlab.local”
APPD_CONTROLLER_PORT="8090”
APPD_ACCESS_KEY="a4abcdc7-ce1c-41cb-[cut]”
APPD_ACCOUNT_NAME="customer1”
APP_NAME="$parentJobName” ($parentJobName will be replaced by the value WPDEMO, that is the name given to the deployment by the user)
TIER_NAME="$cliqrAppTierName” ($cliqrAppTierName will be replaced by the value WSERVER, that is how the tier is identified in the Application Profile)
HOST_NAME="$cliqrNodeHostname" ($cliqrNodeHostname will be replaced by the value C3-b2a9-WPDEMO-WSER, generated by CloudCenter when it provisions the VM)

This video (2 min) shows how the existing Application Profile is updated adding the deployment of the AppDynamics agent:


Tetration: Architecture of the system


Tetration is a ready-to-use big data platform which runs a Hadoop cluster on its core.
As described in a previous post, Tetration collects telemetry streamed by software and hardware sensors. It stores metadata within the data lake and runs machine learning algorithms to provide business outcomes
Tetration sensors, downloaded from the cluster itself, embed the required configuration and don’t need any user input. As soon as they are installed, they start to stream rich telemetry and can optionally control local workload policy enforcement


Tetration overview
Tetration overview


CloudCenter integration with Tetration


At deployment time, a dropdown list allows the user to select one of the two types of sensor: Deep Visibility, or Deep Visibility with Enforcement (of security policies).

The telemetry data for this application are segregated under a specific scope, created by CloudCenter during the provision phase using the variable $parentJobName (containing the value WPDEMO in our demonstration).
The sensor are installed in each VM via a custom script, as described by next picture:


installing and configuring Tetration agents
installing and configuring Tetration agents


application VM with all the agents installed
Wordpress VM with all the agents installed

Next video (6 min) shows how a service (Tetration Injector) is created and then added to the existing Application Profile:


Result of the deployment seen in CloudCenter, Tetration and AppDynamics


This video shows the deployment of the Wordpress application from the CloudCenter self-service catalog.


And next video shows the analysis of telemetry data in Tetration, when the Wordpress application is deployed:


Finally, we look at AppDynamics to see the analysis of the behavior of the application from a business standpoint:


Summary 

Only Cisco can offer automated end-end, real-time application intelligence giving you 360 of visibility at business and network side Do you want to run this demo in your lab? Engage with us to setup a Lab.
All source code, the CloudCenter Services and the Application Profiles are available on github.

Credits and Disclaimer

This post describes a lab activity that was implemented by two colleagues of mine, Riccardo Tortorici and Stefano Gioia.
We created a demonstration lab to show our customers how easy it is to integrate the three products.
This is not the official documentation from Cisco about the integration, that will be released soon. 

References

Previous post on the integration of CloudCenter with Tetration: https://lucarelandini.blogspot.it/2017/10/turn-lights-on-in-your-automated.html


July 28, 2017

Protecting your border or offering a service to others?

The value of automation in the DataCenter

Everyone is aware of the value of the automation.
Many companies and individual engineers implemented various ways to save time, from shell scripts to complex programs and to fully automated IaaS solutions.

It helps reducing the so called "Shadow IT", a phenomenon that happens when developers can't get a fast enough response from the IT of the company and rush to the public cloud to get what they need. Doing that they complete and release their project soon, but sometimes troubles start with the production phase of the deployment (unexpected additional budget for the IT, new technologies that they are not ready to manage, etc.).


shadow IT happens when corporate IT is not fast enough

For sure, some departments are organized in silos (a team responsible for servers, one for storage, one for networking, one for virtual machines, of course one for security...) and the provisioning of even simple requests takes too long.


process inefficiency due to silos and wait time


Pressure on the infrastructure managers

So there is inefficiency in the company, that affects the business outcome of every project.
Longer time to market for strategic initiatives, higher costs for infrastructure and people.
Finger pointing starts, to identify who is responsible for the bottleneck.

The efficiency of teams and individuals is questioned, and responsibility is cascaded through the organization from project managers to developers, to the server team, to the storage team and generally the network is at the end of the chain... so that they have no one else to blame.

Those on the top (they consider themselves on top of the value chain) believe - or try to demonstrate - that their work is slowed down by the inefficiency of the teams they depend on. They try to suggest solutions like: "you said that your infrastructure is programmable, now give me your API and I will create everything I need on demand".

Of course this approach could bring some value (not much, as we'll see in the rest of the post) but it mines the relevance of the specialists teams that are supposed to manage the infrastructure according to best practices, to apply architectural blueprints that have been optimized for the company's specific business, to know the technology in deeper detail.
So they can't accept to be bypassed by a bunch of developers that want to corrupt the system playing with precious assets with their dirty hands.


The definitive question is: who owns the automation?
Should it be left to people that know what they need (e.g. Developers)?
Should it be owned by people that know how technology works, and at the end of the day are responsible for the SLA including performances, security and reliability that could be affected by a configuration made by others (i.e. IT Administrators)?


In my opinion, and based on the experience shared with many customers, the second answer is the correct one.
By definition the developer is not an expert on security: if he can easily program a switch via its REST API to get a network segment, it’s not the same when traffic needs to be secured and inspected.


The IT admin patrols the infrastructure
The IT Admin patrolling the infrastructure


Offering a self service catalog (or API)

A first, immediate solution could be the introduction of an easy automation tool like Cisco UCS Director, that manages almost every element in a multi vendor Data Center infrastructure: from servers to networks to storage to virtualization in a single dashboard. But what is more interesting is that every atomic action you do in the GUI is also reflected in a task in the automation library, that allows you to create custom workflows lining all the tasks for a process that you want to automate.
A common example of automation workflow is the creation of a 4-hypervisors server farm.
A single workflow starts from the SAN storage creating a volume and 4 LUN, where the hypervisor will be installed to enable remote boot for the servers. Then a network is created (or the existing management network will be used) and 4 Service Profiles (the definition of a server in Cisco UCS) are created from a template, with individual ip address, mac address and wwn for each network interface. Then, zoning and masking are executed to map every new server to a specific LUN and the service profiles are associated to 4 available servers (either blades or rack mount servers). The hypervisors are installed using the PXE boot, writing the bytes in the remote storage, configured and customized, and finally added to a (new) cluster in the hypervisor manager (e.g. vCenter).

All this process takes less then one hour: you could launch it and go to lunch, when you're back you'll find the cluster up and running. Compare it to a manual provisioning of the same server farm, eventually performed by a number of different teams (see the picture above): it would take days, sometimes weeks. 
Other use cases are simpler: maybe just creating a 3 tier application with VM and dedicated networks.

Once the automation workflow has been built and validated, it can be used by the IT admin or by the Operations everyday, to save time and ensure consistent outcome (no manual errors). But it can also be offered as a service to all the departments that depend on the IT for their projects. 

You can build a service catalog with enterprise features: multitenancy, role based access control, reporting, chargeback, approvals, etc. But you can also offer (secured) access to the API to launch the workflow, offering a degree of autonomy to your consumers. Eventually, using a resource quota: you don’t want everyone to be able to create dozens of VMs every hour if the capacity of the system can't sustain it. 

They will appreciate the efficiency improvement, for sure.


What's in it for me?


If you allow your internal clients to self serve, you will: 

  • get less requests for trivial tasks, that consume time and give no satisfaction (let them play with it),
  • be the hero of the productivity increase (no requests pending in your queue)
  • dedicate your time and skill to designing the architectural blueprint that will be offered as a service to your clients (so that everybody plays according to your rules)
  • use policy based provisioning, so that you define the rules just once and map them to tenants and environments: every deployment will inherit them
  • maintain control on resource consumption and system capacity, hence on costs and budget
  • increase your relevance: they will come to you to discuss their needs, propose new services, collaborate in governance

Example: network provisioning


The discussion above is valid for the entire infrastructure in the Data Center.
Now I tell you the story of a customer that implemented it specifically for the networking.

They were influenced by the trend about SDN and initially they were caught in the marketing trap "SDN means software implemented networking, hence overlay". Then they realized the advantage provided by ACI and selected it as the SDN platform ("software defined networking", thanks to the software controller and the ACI policy model).

Developers and the Architecture department asked to access the API exposed to self provision what they needed for new projects, but this was seen as an invasion of the property (see the picture with the dirty hands).

It would have worked, but it implied a transfer of knowledge and delegation of responsibility on a critical asset. At the end of the day, if developers and software designers had knowledge in networking, specialists would not exist.

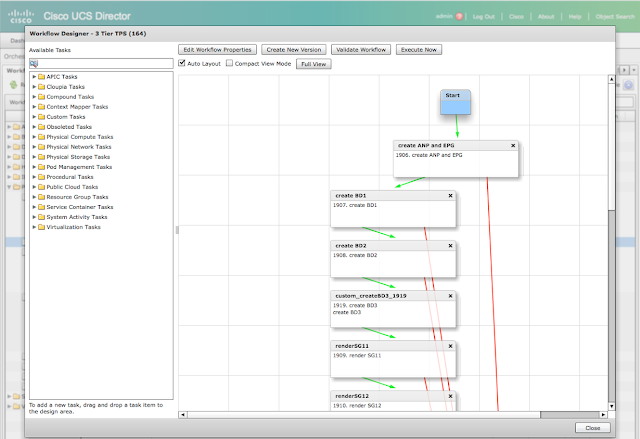
So the network admins built a number of workflows in UCS Director, using the hundreds of tasks offered by the automation library, to implement some use cases ranging from basic tasks (allow this VM to be reached from the DMZ) to more complex scenarios (create a new environment for a multi tier application including load balancer and firewall configuration, plus access from the monitoring tools, with a single request).


3 tier application blueprint
Blueprint designed in collaboration with Security and Software Architects


Graphical editor for the workflows, with the tasks library
Graphical Editor for the workflow


These workflows are offered in a web portal (a service catalog is offered by UCSD out of the box) and through the REST API exposed by UCSD. Sample calls were provided to consumers as python clients, powershell clients and Postman collections, so that the higher level orchestration tool maintained by the Architecture dept was able to invoke the workflows immediately, inserting them in the business process automation that was already in place.


Example of python client running a UCSD workflow


All the executions of the workflows - launched through the self service catalog or through the REST API - are tracked in the system and the administrator can inspect the requests and their outcome:

The IT admin can audit the requests for the automation workflows
The Service Requests are audited and can be inspected and rolled back

 Any run of the workflow can be inspected in full detail, look at the tabs in the window:


The IT admin can inspect any run of the workflows
The Admin has full control (see the tabs in the window)


References

Cisco UCS Director
Cisco ACI 
ACI for Simple Minds
ACI for (Smarter) Simple Minds
Invoking UCS Director Workflows via the Northbound API