Showing posts with label security. Show all posts

July 28, 2023

Why Application Security is important (and complementary to perimeter security)?

Outstanding application security is foundational to a brand's reputation, creating and building trust and loyalty with users. But vulnerabilities can occur anytime, anywhere (in your code, in commercial applications, in libraries you've integrated and in remote API that you invoke), making it difficult and time-consuming to prioritize responses. 

<Suggestion for people in a rush> If you only have 5 minutes, just scroll down and look at the amazing recorded demo: it explains everything better than the post itself </Suggestion for people in a rush>


Avoiding costly delays that can result in continuing damage to revenue and brand reputation means organizations must have clear visibility into each new vulnerability and the insights needed to prioritize remediation based on their business impact.

The traditional security schema, based on just protecting the perimeter with firewalls and IPS, is no longer sufficient. You need to protect the full stack, including all the software tiers. 


Business Risk Observability

Speed and coordination are paramount when dealing with application security risks.  

Bad actors can take advantage of gaps and delays between siloed security and application teams, resulting in costly and damaging consequences. Traditional vulnerability and threat scanning solutions lack the shared business context needed to rapidly assess risks and align teams based on potential business impact. To triage and align teams as fast as possible, teams need to know where vulnerabilities and threats impact their applications, how likely a risk is to be exploited, and how much business risk each issue presents.

One fundamental use case in Full-Stack Observability is business risk observability, supported by new levels of security intelligence capability that brings business context into application security. The new business risk scoring enables security and applications teams to have a greater threat visibility and intelligent business risk prioritization, so that they respond instantly to revenue-impacting security risks and reduce overall organizational risk profiles.

New Cisco Secure Application features and functionalities include business transaction mapping to understand how and where an attack may occur; threat intelligence feeds from Cisco Talos, Kenna, and Panoptica; and business risk scoring. 

Business Transaction Mapping 

New business transaction mapping locates how and where an attack may occur within common application workflows like ‘login, checkout, or complete payment’ so that ITOps and SecOps professionals can instantly understand the potential impact to your application and your bottom line.

Threat Intelligence Feeds 

New threat intelligence feeds from Cisco Talos, Kenna, and Panoptica provide valuable risk scores from multiple sources to assess the likelihood of threat exploits

Business Risk Scoring (for Security Risk Prioritization)

New Business risk scoring combines threat and vulnerability intelligence, business impact and runtime behavior to identify the most pressing risks, avoiding delays, and speeding response across teams.


Video Demonstration of the Business Risk Observability use case

See a complete, explanatory demonstration of how a risk index associated to your business transactions allows to discover and remediate vulnerabilities with a proper priority assessment:

https://video.cisco.com/detail/video/6321988561112 


July 14, 2023

Navigating relationships across monitored entities

I have described the Cisco FSO Platform as an extensible, developer friendly platform that can ingest all kinds of telemetry and is able to correlate those data into a meaningful insight.

But... what does it really mean? Some readers told me it's an abstract concept, they don't get how it relates to their daily job in IT Operations.

Let's define telemetry first: it is all the data that you can get from a running system, like a Formula 1 car running on the race track (speed, consumption, temperature, remaining fuel, etc.). Or from your IT systems, that include applications, infrastructure, cloud, network, etc. In this case, data come in the form of Metrics (any number you can measure), Events (something that happened at an instant in time), Logs (information written by a system somewhere) and Traces (description of the execution of a process).


This is the origin of the acronym MELT, that you see written on the walls these days. Everyone is excited by Observability, that is the ability to infer the internal state of the system by looking at its external signals (e.g. collecting MELT). Generally, Observability is realised within a domain: a consistent set of assets of the same type (technologies, devices, or business processes). Example: network monitoring, application performance monitoring (APM), etc.

The fun comes when you're able to correlate MELT to investigate the root cause of an issue, or to find spots for optimising either performance or cost, or to demonstrate business stakeholders that all the business KPI are OK thanks to the good job done by the IT Operations folks :-)  

Even better when you're able to correlate MELT across different domains, to extend observability end-to-end. The entire business architecture is under control. You can navigate all the relationships that link the entities that are relevant in your monitoring, and see if any of those is affecting the global outcome (faults, bottlenecks, etc.).

Example: LinkedIn

One illuminating example for this type of navigation is the parallelism with the LinkedIn website, and the exploration of your network of contacts to find a specific person, or information about their professional role, their company, their activity.

Every IT professional I know has a profile on LinkedIn, and each of them generates information: they post articles or photos, they react to others' posts (either repost, or suggest/like them), they advertise events, they update their profile (this can be associated to generating MELT). In addition, everyone is connected to other people, so that you have 1st degree (direct) connections but also 2nd degree connections that you inherit from the 1st degree ones.

Click on the video below to see a graphical representation of the navigation across a network of connections on Linkedin, and the flow of information generated by each one of the people in the network.


Now you can imagine a similar network of logical connections among entities that you monitor with the Full Stack Observability platform. You can explore how they are related to each other, and how every one affects the behaviour and the outcome of the others.

In a typical IT scenario, the entities might be the navigation of a user in the software application that supports a digital service (a Business Transaction), a service, the Kubernetes cluster where the service is running, a K8s node, the server running the node (that might be a VM in the cloud), the network segment to connect to the cloud, the cost of cloud resources, the carbon footprint generated by the infrastructure.

Correlation

All the relationships among the monitored entities are explicitly shown in the user interface, and you can move your focus to another object and inspect it, accessing the current health state, its history, and all the Metrics, Events, Logs and Traces it has generated. This makes extremely easy to understand if an issue detected in one of the entities propagates to others, affecting the way they work.

Also the Health Rules that you can define for one entity could include the evaluation of related entities, so that you roll up warnings and awareness at the top level based on what supporting entities are doing.


In this screenshot I've highlighted the list of relationships in the panel on the left side, with a green dashed line. That list continues, so scrolling down you would also see Workloads, Pods, Containers, Hosts, Configurations, Persistent Volume Claims, Ingresses, Load Balancers and Teams (yes, the organisational teams that are responsible for this cluster). The number on each entity type shows how many objects of that type are related to the one (the K8s cluster) that is currently in focus in the central pane.

Though we have information about all the entities in the system, all the objects that are not in direct relationship with the entity in focus are automatically hidden in the list, to remove what we call the "background noise". Showing only what really matters increases focus, and makes the investigation easier. You can click, let's say, on the two Business Transactions (luckily in this example both are in green health state) to see what business processes would be impacted by a problem occurring in this K8s cluster.

Of course, scrolling down we would see in the central panel all the information available about this cluster, including all the MELT it has generated in the time interval under investigation (see the options below).


What I have described in this post is just the basic capabilities of the Cisco FSO Platform. You can find the full detail in the official documentation
In next posts, I'll explain the most relevant use cases and the impact that Full Stack Observability can have on your business.


July 8, 2023

FSO Platform: see everything, correlate everything

The Cisco Full Stack Observability Platform

Cisco has been the first vendor to offer a end-to-end observability solution, based on complementary products that are integrated into each other. The use cases described in my previous post are served by a combination of AppDynamics and ThousandEyes, with information fed by first class security system as Talos, Kenna and Panoptica (more in next posts).

Even if another vendor had such an extensive coverage (and they have not), they would not be integrated out of the box. The native integration enhances the power of each product (Applications Ops see also the network, Network Ops see also the applications, Security Ops see everything, everybody get the business context) and saves a lot of time and effort that a custom integration would require. 

But we think this is not enough.

Some companies are already very advanced in their journey to Observability. They have already adopted advanced solutions from APM vendors (including Cisco and competitors), network monitoring and cloud services monitoring. Some have built sophisticated home grown systems for Observability and AIOps. 

They might find that the predefined view of the world that is implemented in traditional APM solutions is not enough. Entities like an Application, a Service, a Business Transaction and their relationship might not be sufficient to describe their business domain, or a technical domain that is more complicated than common architectures. They would like to extend the domain model, but they can't because the solution has not been designed for extensibility.

Extensibility of the Observability solution

What they are looking for is the possibility to extend their visibility, and the possibility to correlate collected information to describe what's relevant for them.


Here comes the Cisco FSO Platform. 

The Cisco FSO Platform is an open, extensible, API driven platform that empowers a new observability ecosystem for organizations. It is a unified platform built on OpenTelemetry (an open source project by CNCF) and anchored on metrics, events, logs and traces (MELT), enabling extensibility from queries to data models with a composable UI framework.   

Cisco FSO Platform is a developer friendly environment to build your own view of the world.

You can tailor the Full Stack Observability to your business domain, or to your technical domain, defining the entities that are relevant for your stakeholders and the relationships that tie them. From business processes to every asset included in your architecture: applications, infrastructure, cloud, network, IoT and business data sources.

Creating a series of connections that you can navigate to fully control what's going on, as you do on Linkedin exploring a people's network and the information they generate (see next post for an example). All based on telemetry that you can collect from virtually everything: Metrics, Events, Logs and Traces. A new open standard, OpenTelemetry (supported by vendors and by the open source community), defines the way data are collected and ingested. These data feed the domain model, and you can later use them to investigate about the root cause of any issue, or to report about the business health state, or to look for opportunities to improve the efficiency.

The Cisco FSO platform is a differentiated solution that brings data together from multiple domains such as application, networking, infrastructure, security, cloud and business sources. Users can get correlated insights that reduce time to resolve issues and optimize experiences; while Partners, ISVs, and software developers can now build meaningful FSO applications enabling new use cases.  


So there are alternative solutions for Full Stack Observability?

In their evolution from traditional monitoring, organizations go through some maturity steps. It's not a revolution in one day.

Someone starts replacing individual tools with more complete solutions that unify the visualization of collected metrics from different technical domains. Others start correlating those data with business metrics and KPI. Then they extend the observability to - really - the full stack.

For all those, the solution that I started describing in my previous post provides an excellent value. The seven use cases I've mentioned are completely supported by the Cisco FSO solution based on the integration of Appdynamics, ThousandEyes and the security ecosystem. It's well integrated and offers the various operations teams access to deep visibility as well as shared business context.

Some organizations are already in a more advanced state. They have already realized the Full Stack Observability, either adopting the Cisco solution or a competing one, or growing a AIOps system in house. But they feel that they need more, because their business domain (or parts of their technical domain) is not completely covered by the solution they have.

Thanks to the Cisco FSO Platform, that is extensible and developers friendly, they can build the needed extension themselves (or can have a look at the Cisco FSO App Exchange).  This powerful engine, that backs all the Cisco FSO products, will allow those organizations to ingest telemetry from virtually every asset and to show correlated data based on their desired view of the world.

So finally we have two parallel motions, that don't conflict necessarily. The adoption of one or the other depends on your current observability maturity level and specific need for tailored dashboards.

In next post I will show a parallelism between the navigation across your LinkedIn network of contacts and the navigation through connected entities in the FSO Platform to search for the root cause of an issue by exploring Metrics, Events, Logs and traces associated to each entity.

Subsequently, I will describe fundamental use cases like Business Risk Observability.


June 29, 2023

Full Stack Observability use cases

Business Use Cases

Full Stack Observability is all about collecting any possible data from the applications running your digital services (i.e. business KPI) and from the infrastructure and cloud resources supporting them (i.e. the telemetry), including potentially also IoT, robots or whatever device involved in the process.

And then correlating those data to create an actionable insight, so that you have full control of your business processes end-to-end and you do better than your competitors (faster, more reliable, more appealing processes and services).  

The FSO value proposition is not only related to technology (the infrastructure that you can monitor and the metrics you can read). It is a business value proposition, because observability has an immediate impact on the business outcomes.


Associating business processes, and digital services supporting those, with the health state of the infrastructure gives the Operations teams an immediate and objective measure of the value - or the troubles - that IT provides to their internal clients, that are the lines of business (LOB). And LOB managers can enjoy dedicated dashboards that show how the business is doing, highlighting all the key performance indicators (KPI) that are relevant for each persona in the organization.  

If there is any slowdown in the business, they see it instantly and can eventually relate it to a technical problem, or maybe to the release of a new version of a software application, or to the launch of a new marketing campaign. The outcome of any action and of any incident is connected to the business with... no latency. The same visibility is also useful when the business shows a better performance than the day before. You can relate outcomes to actions and events.

So, before speaking about the technology that supports the Full Stack Observability, let's discuss about the use cases and their impact.

We can group the use cases in three categories: Observe, Secure and Optimize (referred to your end-to-end business architecture).


In the Observe category, we have 4 fundamental use cases:

- Hybrid application monitoring

This refers to every application running on Virtual Machines, in any combination of your Data Center and Public Clouds, or on bare metal servers.

You can relate the business KPI (users served, processes completed, amount of money, etc.) to the health state of the software applications and the infrastructure. You can identify the root cause of any problem and relate it to the business transactions (= user navigation for a specific process) that are affected.

- Cloud native application monitoring

Same as the previous use case, but referred to applications designed based on cloud native patterns (e.g. microservices architecture) that run on Kubernetes or Openshift. Regardless it's on premises, in cloud, or in a hybrid scenario. Traditional APM solutions were not so strong on this use case, because they were designed for older architectures.

- Customer digital experience monitoring

Here the focus is on the experience from the end user perspective, that is affected by the performance of both the applications and the infrastructure, but also - and mostly - by the network. Network problems can eventually affect the response time and the reliability of the service because the end user needs to reach the end point where the application is run (generally a web server), the front end needs to communicate with the application components distributed everywhere, and these may be invoking remote API exposed by a business partner (e.g. a payment gateway or any B2B service).

- Application dependency monitoring

In this use case you want to assure the performance of managed and unmanaged (third-party) application services and APIs, including performance over Internet and cloud networks to reach those services. Visibility of network performance and availability, including both public networks and yours, is critical to resolve issues and to push service providers to respect the SLA of the contract.

In the Secure category, we can discuss the Business Risk Observability use case:

- Application security

Reduce business risk by actively identifying and blocking against vulnerabilities found in application runtimes in production. Associate vulnerabilities with the likelihood that they are exploited in your specific context, so that you can prioritize the suggested remediation actions based on the business impact (shown by the association of vulnerabilities with Business Transactions).

In the Optimize category, we have the following use cases:

- Hybrid cost optimization

Lower costs by only paying for what you need in public cloud and by safely increasing utilization of on—premises assets.

- Application resource optimization

Improve and assure application performance by taking the guesswork out of resource allocation for workloads on—premises and in the public cloud.


Observability and network intelligence coming together

The use cases listed above goes beyond the scope of traditional APM solutions (Application Performance Monitoring) because they require to extend the visibility to every segment of the network. This picture shows an example of possible issues that can affect the end user experience, and need to be isolated and remediated to make sure the user is happy.


That is generally difficult, and requires a number of subject matter experts in different domains, and a number of tools. Very few vendors can offer all the complementary solutions that give you visibility on all aspects of the problem. And, of course, they are not integrated (vertical, siloed monitoring). 

Data-driven bi-directional integration 

The Full Stack Observability solution from Cisco, instead, covers all the angles and - in addition - it does so in a integrated fashion. The APM tool (AppDynamics) and the Network Monitoring tool (ThousandEyes) are integrated bidirectionally through their API (out of the box, no custom integration is required).


The visibility provided by one tool is greatly enhanced by data coming from the other tool, that are correlated automatically and shown in the same console.

So, if you're investigating about a business transaction, you don't see just the performance of the software stack and its distributed topology, but also the latency, packet loss, jitter and more network metrics in the same context (exactly in the network segments that impact the traffic for that single business transaction, at that instant in time).

Similarly, if you're looking at a network, you immediately know what applications and business transaction would be affected if it fails or slows down. And automated tests can be generated to monitor the networks and the end points, that are created automatically from the topology of the application that the APM tool has discovered.

Exciting times are coming, the Operations teams can expect their life to be much easier when they start adopting a Full stack Observability approach. More detail in next posts...


October 23, 2017

Turn the lights on in your automated applications deployment - part 2

In the previous post we described the benefit of using Application Automation in conjunction with Network Analytics in the Data Centre, a Public Cloud or both. We described two solutions from Cisco that offer great value individually, and we also explained how they can multiply their power when used together in an integrated way.
This post describes a lab activity that we implemented to demonstrate the integration of Cisco Tetration (network analytics) with Cisco CloudCenter (application deployment and cloud brokerage), creating a solution that combines deep insight into the application architecture and into the network flows.
The Application Profile managed by CloudCenter is the blueprint that defines the automated deployment of a software application in the cloud (public and private). We add information in the Application Profile to automate the configuration of the Tetration Analytics components during the deployment of the application.

Deploy a new (or update an existing) Application Profile with Tetration support enabled

Intent of the lab:
To modify an existing Application Profile or model a new one so that Tetration is automatically configured to collect telemetry, leveraging also the automated installation of sensors.
Execution:
A Tetration Injector service is added to the application tiers to create a scope, define dedicated sensor profiles and intents, and automatically generate an application workspace to render the Application Dependency Mapping for each deployed application.
Step 1 – Edit an existing Application Profile
Cisco CloudCenter editor and the Tetration Injector service


Step 2 – Drag the Tetration Injector service into the Topology Modeler 


Cisco CloudCenter editor

Step 3 – Automate the deployment of the app: select a Tetration sensor type to be added
Tetration sensors can be of two types: Deep Visibility and Deep Visibility with Policy Enforcement. The Tetration Injector service allows you to select the type you want to deploy for this application. The deployment name will be reflected in the Tetration scope and application name.

Defining the Tetration sensor to be deployed

Two types of Tetration sensors

In addition to deploying the sensors, the Tetration injector configures the target Tetration cluster and logs all configuration actions leveraging the CloudCenter centralized logging capabilities.
The activity is executed by the CCO (CloudCenter Orchestrator):
CloudCenter Orchestrator

Step 4 – New resources created on the Tetration cluster
After the user has deployed the application from the CloudCenter self-service catalog, you can go to the Tetration user interface and verify that everything has been created to identify the packet flow that will come from the new application:
Tetration configuration

In addition, the software sensors (also called Agents) are recognized by the Tetration cluster:

Tetration agents

Tetration agents settings


Tetration Analytics – Application Dependency Mapping

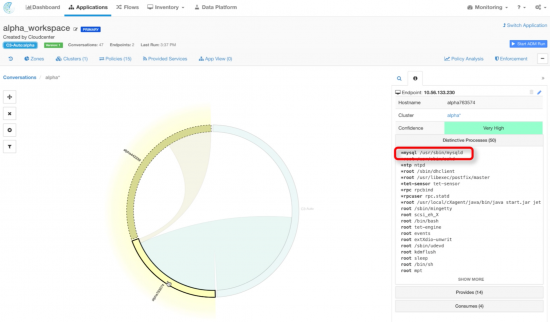
An application workspace has been created automatically for the deployed application, through the Tetration API: it shows the communication among all the endpoints and the processes in the operating system that generate and receive the network flows.
The following interactive maps are generated as soon as the network packets, captured by the sensors when the application is used, are processed in the Tetration cluster.
The Cisco Tetration Analytics machine learning algorithms grouped the applications based on distinctive processes and flows.
The figure below shows how the distinctive process view looks like for the web tier:
Tetration Application Dependency Mapping


The distinctive process view for the database tier: 

Tetration Application Dependency Mapping


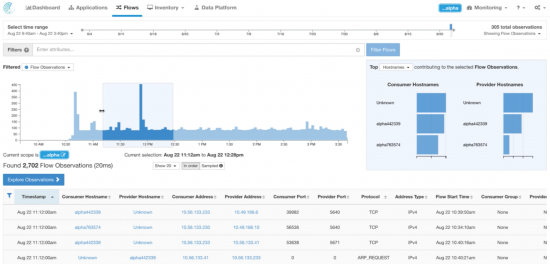
Flow search on the deployed application:  


Detail of a specific flow from the Web tier to the DB tier: 

 Tetration deep dive on network flow


Terminate the application: De-provisioning
When you de-provision the software application as part of the lifecycle managed by CloudCenter (with one click), the following cleanup actions will be managed by the orchestrator automatically:
  • Turn off and delete VMs in the cloud, including the software sensors
  • Delete the application information in Tetration
  • Clear all configuration items and scopes

Conclusion

The combined use of automation (deploying both the applications and the sensors and configuring the context in the analytics platform) as well as the telemetry data that are processed by Tetration help in building a security model based on zero-trust policies.
The following use cases enable a powerful solution thanks to the integrated deployment:
  • Get communication visibility across different application components
  • Implement consistent network segmentation
  • Migrate applications across data center infrastructure
  • Unify systems after mergers and acquisitions
  • Move applications to cloud-based services
Automation limits the manual tasks of configuring, collecting data, analyzing and investigating. It makes security more pervasive, predictive and even improves your reaction capability if a problem is detected.
Both platforms are constantly evolving and the RESTful API approach enables extreme customization in order to accommodate your business needs and implement features as they get released.
The upcoming Cisco Tetration Analytics release – 2.1.1 – will bring new data ingestion modes like ERSPAN, Netflow and neighborhood graphs to validate and assure policy intent on software sensors.
You can learn more from the sources linked in this post, but feel free to add your comments here or contact us to get a direct support if you want to evaluate how this solution applies to your business and technical requirements.

Credits

This post is co-authored with a colleague of mine, Riccardo Tortorici.
He is the real geek and he created the excellent lab for the integration that we describe here, I just took notes from his work.

References


October 20, 2017

Turn the lights on in your automated applications deployment - part 1

A very common goal for software designers and security administrators is to get to a Secure Zero-Trust model in an Application-Centric world.
They absolutely need to avoid malicious or accidental outages, data leaks and performance degradation. However this can be very difficult to achieve sometimes, due to the complexity of distributed architectures and the coexistence of many different software applications in the modern shared IT environment.
Two very important steps in the right direction can be Visibility and Automation. In this blog, we will see how the combination of two Cisco software solutions can contribute towards achieving this goal.
This is the description of a lab activity, that we implemented to show the advantage from the integration of Cisco Tetration Analytics (providing network analytics) with Cisco CloudCenter (application deployment and cloud brokerage), creating a really powerful solution that combines deep insight into the application architecture and into the network flows.

Telemetry from the Data Center


Tetration provides telemetry data for your applications

Cisco Tetration Analytics captures telemetry from every packet and every flow, delivers pervasive real-time and historical visibility across your data center, providing a deep understanding of application dependencies and interactions. You can learn more here: http://cs.co/9003BvtPB.
Main use cases for Tetration are:
  • Pervasive Visibility
  • Security
  • Forensics/Troubleshooting, Single Source of Truth
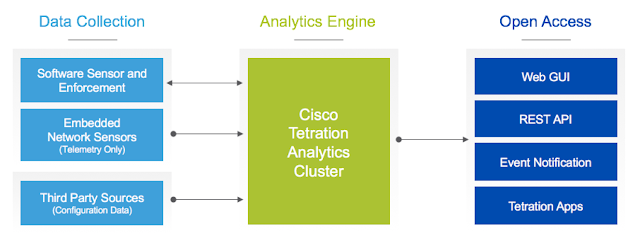
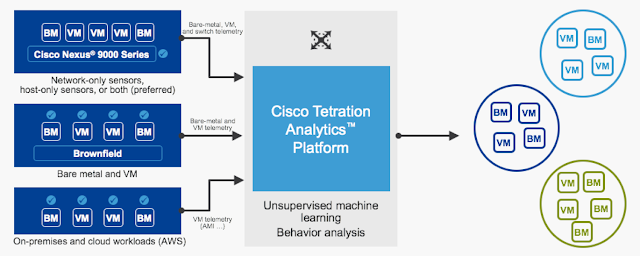
The architecture of Tetration Analytics is made of a big data analytics cluster and two types of sensors: hardware and software based. Sensors can be either in the switches (hw) or in the servers (sw).
Data is collected, stored and processed through a high performance customized Hadoop cluster, which represents the very inner core of the architecture. The software sensors will collect the metadata information from each packet’s header as they leave or enter the hosts. In addition, they will also collect process information, such as the user ID associated with the process and OS characteristics.

Tetration high level architecture


Tetration can be deployed today in the Data Center or in the cloud (AWS). The choice of the best placement depends on whether you have more deployments on cloud or on premises.
Thanks to the knowledge obtained from the data, you can create zero-trust policies based on white lists and enforce them across every physical and virtual environment. By observing the communication among all the endpoints, you can define exactly who is allowed to contact who (white list, where everything else is denied by default). This applies to both Virtual Machines and Physical Servers (bare metal), including your applications running in the public cloud.
As an example, one of your database servers will be only accessed by the application servers running the business logic for that specific application, by the monitoring and backup tools and no one else. These policies can be enforced by Tetration itself or exported to generate policies in an existing environment (e.g. Cisco ACI).

Behavior analysis of workloads deployed everywhere

Another benefit of the network telemetry is that you have visibility on any packet, any flow at any time (you can keep up to 2 years of historical data, depending on your Tetration deployment and DC architecture) among two or more application tiers. You can detect performance degradation, ie increasing latency between two application tiers and see the overall status of any complex application.

How to onboard applications in Tetration Analytics
When you start collecting information from the network and the servers into the analytics cluster, you need to give it a context. Every flow needs to be associated to applications, tenants, etc. so that you can give it business significance.
This can be done through the user interface or through the API of the Tetration cluster, matching metadata that come associated with the packet flow. Based on this context, reports and drill down inspection will give you an insight on every breath that the system does.

Automation makes Deployment of Software Applications secure and compliant

The lifecycle of Software Applications generally impacts different organizations in the IT, spreading responsibility and making it hard to ensure quality (including security) and end-to-end visibility.
This is where Cisco Cloud Center comes in. It is a solution for two main use cases:
  • modeling the automated deployment of a software stack (creating a template or blueprint for deployments)
  • brokering cloud services for your applications (different resource pools offered from a single self-service catalog). You can consume IaaS and PaaS services from any private and public cloud, with a portable automation that frees you from lock-in to a specific cloud provider.
Cisco CloudCenter: one solution for all clouds


Integration of Automated Deployment and Network Analytics

It is important to note that both platforms are very open and come with a significant support for integration API. The joint usage means benefitting from the visibility and the automation capabilities of each product:
CloudCenter
  • Application architecture awareness (the blueprint for the deployment is created by the software architect)
  • Operating System visibility (version, patches, modules and monitoring)
  • Automation of all configuration actions, both local (in the server) and external (in the cloud environment)
Tetration Analytics
  • Application Dependency Mapping, driven by the observation of all communication flows
  • Awareness of Network nodes behavior, including defined policies and deviations from the baseline
  • Not just sampling, but storing and processing anytime metadata for any single packet in the Data Center

The table below shows how each engine provides additional value to the other one:
Leveraging the integration between the two solutions allows a feedback loop between applications design and operations, providing compliance, continuous improvement and delivery of quality services to the business.

Consequently, all the following Tetration Analytics use cases are made easier if all the setup is automated by CloudCenter, with the advantage of being cloud agnostic:
Cisco Tetration use cases


Of course one of the most tangible results claimed by this end-to-end visibility and policy enforcement is security.
More detail on the integration between CloudCenter and Tetration Analytics are described in the second part of this post, where we will demonstrate how easy it is to automate the deployment of software sensors along with the application, as well as preparing the analytics cluster to welcome the telemetry data.

Credits

This post is co-authored with a colleague of mine, Riccardo Tortorici.
He is the real geek and he created the excellent lab for the integration that we describe here, I just took notes from his work.

References