If you are not interested in the detail, at least browse the post and watch the amazing video recordings embedded :-)
We have already discussed the value of automation in the deployment of software applications.
It is also clear that collecting telemetry data from systems and applications into analytic platforms enhances visibility and control, with an important return on your business.
Cisco offers best of breed solutions for both automation and analytics, but the biggest value is in their integration end to end. Your applications can be deployed with Cisco CloudCenter and completely controlled with AppDynamics and Tetration, with no manual intervention.
Why do you need that visibility?
CloudCenter offers your users a self service catalog where applications can be selected for deployment in one of the clouds you have configured as a target: but the smartest feature is that every deployment can also install the sensors for AppDynamics and Tetration automatically in each node of the application topology, so that telemetry data start to be collected immediately.
 |
| why we need to collect information at runtime |
With that, now you have no excuse to keep running applications that do not perform well enough, that expose vulnerabilities and that produce limited business return due to poor customer satisfaction or inefficiency. The same applies to non compliant applications that break your security rules or your architectural standards, that were deployed some years ago and now are untouchable due to complexity and lack of documentation.
With such an easy integration of telemetry and the insight that you can get immediately, it makes no sense keep those monsters running in your datacenter or in your cloud. You can evolve them and remove the bottlenecks and security risks once identified.
 |
| Analytic tools add value to the application telemetry |
We want to demonstrate how easy it is.
This post is a follow up to the demonstration of the integration of Cisco CloudCenter with Tetration: we extended the demo with the addition of AppDynamics, so that our applications are now completely under control when it comes to security, compliance, performances and business impact.
This post is a follow up to the demonstration of the integration of Cisco CloudCenter with Tetration: we extended the demo with the addition of AppDynamics, so that our applications are now completely under control when it comes to security, compliance, performances and business impact.
Architectural Overview
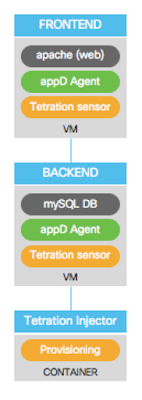
We used a well known application as an example: WordPress is an open source tool for website creation, written in php. It uses a common LAMP stack: Apache + php + mySQL, running on Linux.
Wordpress is a two tier application, so you generally deploy two VM to run it: the front end is an Apache web server with the php application, the back end runs the database (mySQL).
We want that each tier is monitored, as a default, by both AppDynamics and Tetration. This must happen without introducing any complexity for the user that orders Wordpress from the self service catalog and must work in any target cloud. Based on the administrator preference, the user could even be unaware of the monitoring setup.
 |
| Overview of the architecture |
Next paragraphs describe the architecture of AppDynamics and of Tetration, so that you understand what integration we built to make CloudCenter inject telemetry sensors in each deployment.
Then the process triggered when a user deploys Wordpress from the CloudCenter catalog is explained.
Detailed video recording of all the steps is also provided.
Then the process triggered when a user deploys Wordpress from the CloudCenter catalog is explained.
Detailed video recording of all the steps is also provided.
AppDynamics: Architecture of the system
AppDynamics uses agents to collect information from the running servers and to send them to the controller. Agents are specific for the runtime of various programming languages, but there are also agents that interact only with the operating systems: you choose the type of agent that best fits each node. Also databases and their transactions can be monitored.
The Controller is where users go to view, understand, and analyze that data sent by agents.
Agents send data about usage metrics, code exceptions, error conditions and calls to backend systems to the Controller.
 |
| AppDynamics overview |
CloudCenter: the Application Profile
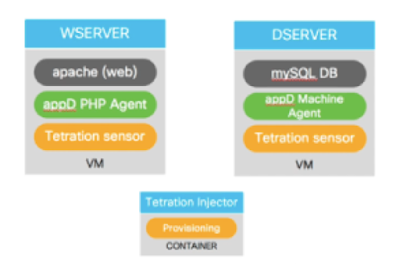
Next
picture shows the Application Profile of the Wordpress service that we
have created in CloudCenter. Each VM in the two tiers will contain the
application and the required sensors for AppDynamics and Tetration.
The
Tetration injector component is an ephemeral Docker container that is
used by CloudCenter just to invoke the API exposed by the Tetration
cluster, so that the telemetry data are welcome when they arrive and
associated to the scope of the Wordpress deployment. It disappears when
the deployment is completed.
 |
| Topology of the application deployment, showing the sensors applied |
As for any other application, the integration is implemented using custom scripts to deploy the agents for AppDynamics and Tetration
All application artifacts, scripts and services are stored in a Repository, and pulled by the CloudCenter agent running in each VM.
CloudCenter executes our scripts during different stages of the deployment, to add the AppDynamics Agent and the Tetration Sensor (using the same technique you could add any other agent that you use for backup, monitoring, etc.).
This is a video (2 min) showing how the Application Profile for Wordpress is built in CloudCenter:
This is a video (2 min) showing how the Application Profile for Wordpress is built in CloudCenter:
CloudCenter integration with AppDynamics
The green boxes in next picture show the sequence of actions executed by the CloudCenter agent to deploy the AppDynamics php agent in the frontend VM: the same actions that the administrator would do manually.
AGENT_LOCATION=“http://cc-repo.rmlab.local”
APPD_CONTROLLER="appd.rmlab.local”
APPD_CONTROLLER_PORT="8090”
APPD_ACCESS_KEY="a4abcdc7-ce1c-41cb-[cut]”
APPD_ACCOUNT_NAME="customer1”
APP_NAME="$parentJobName” ($parentJobName will be replaced by the value WPDEMO, that is the name given to the deployment by the user)
TIER_NAME="$cliqrAppTierName” ($cliqrAppTierName will be replaced by the value WSERVER, that is how the tier is identified in the Application Profile)
HOST_NAME="$cliqrNodeHostname" ($cliqrNodeHostname will be replaced by the value C3-b2a9-WPDEMO-WSER, generated by CloudCenter when it provisions the VM)
This video (2 min) shows how the existing Application Profile is updated adding the deployment of the AppDynamics agent:
Tetration: Architecture of the system
Tetration is a ready-to-use big data platform which runs a Hadoop cluster on its core.
As described in a previous post, Tetration collects telemetry streamed by software and hardware sensors. It stores metadata within the data lake and runs machine learning algorithms to provide business outcomes
Tetration sensors, downloaded from the cluster itself, embed the required configuration and don’t need any user input. As soon as they are installed, they start to stream rich telemetry and can optionally control local workload policy enforcement
 |
| Tetration overview |
CloudCenter integration with Tetration
At deployment time, a dropdown list allows the user to select one of the two types of sensor: Deep Visibility, or Deep Visibility with Enforcement (of security policies).
The telemetry data for this application are segregated under a specific scope, created by CloudCenter during the provision phase using the variable $parentJobName (containing the value WPDEMO in our demonstration).
The sensor are installed in each VM via a custom script, as described by next picture:
 |
| installing and configuring Tetration agents |
 |
| Wordpress VM with all the agents installed |
Next video (6 min) shows how a service (Tetration Injector) is created and then added to the existing Application Profile:
Result of the deployment seen in CloudCenter, Tetration and AppDynamics
This video shows the deployment of the Wordpress application from the CloudCenter self-service catalog.
And next video shows the analysis of telemetry data in Tetration, when the Wordpress application is deployed:
Finally, we look at AppDynamics to see the analysis of the behavior of the application from a business standpoint:
Summary
Only Cisco can offer automated end-end, real-time application intelligence giving you 360 of visibility at business and network side Do you want to run this demo in your lab? Engage with us to setup a Lab.
All source code, the CloudCenter Services and the Application Profiles are available on github.
All source code, the CloudCenter Services and the Application Profiles are available on github.
Credits and Disclaimer
This post describes a lab activity that was implemented by two colleagues of mine, Riccardo Tortorici and Stefano Gioia.
We created a demonstration lab to show our customers how easy it is to integrate the three products.
This is not the official documentation from Cisco about the integration, that will be released soon.
References
AppDynamics: https://www.appdynamics.com/
Previous post on the integration of CloudCenter with Tetration: https://lucarelandini.blogspot.it/2017/10/turn-lights-on-in-your-automated.html
